


Effective Reporting and Sales Operations with AvSight
One of the cornerstones of operational efficiency is precise and actionable reporting. Reports can illuminate the path towards effective and strategic decisions. Over the past few years, Salesforce has emerged as a leading tool in this space, offering a suite of reporting features that transform raw data into insightful narratives. In this article, we will take a look at how AvSight’s capabilities combine with these Salesforce tools to become even more powerful – allowing for a seamless and industry-specific reporting experience.
Salesforce Reporting Overview
Salesforce has presented us with a great comprehensive and intuitive reporting feature. The following are some of the specific tools available from AvSight;
Report Builder
Report Filters
Exporting and Sharing
Permissions and Security
Scheduled Reports
Report Builder: It grants users the ability to create detailed reports through a simple drag-and-drop interface. Users can select fields, group data, and add filters to create custom reports with no coding or technical expertise.
Report Filters: Too much data to handle at a glance? With report filters, users can narrow down and focus on specific criteria. These filters can be based on various attributes (date ranges, record types, custom fields) and they can be grouped and summarized based on the same attributes.
Exporting and Sharing: Reports can be exported in various formats such as PDF, Excel, and CSV. Users also have the ability to make the reports publicly accessible or shared within the organization. Reports can even be displayed graphically on dashboards for easy-to-access insights.
Permissions and Security: Salesforce has also implemented security measures to protect your data. With the inclusion of a robust permission and security settings, you can ensure that employees have access to the data they need while safeguarding sensitive data.
Scheduled Reports: This is a great time-saving feature. Users can set reports to automatically generate and send them to specific recipients at regular intervals. This ensures that key numbers are kept top of mind, without the need for manual processing.
Together, these tools provide a robust framework for understanding your sales and operations data. It also minimizes data entry, allowing your team to spend their time on higher ROI activities.
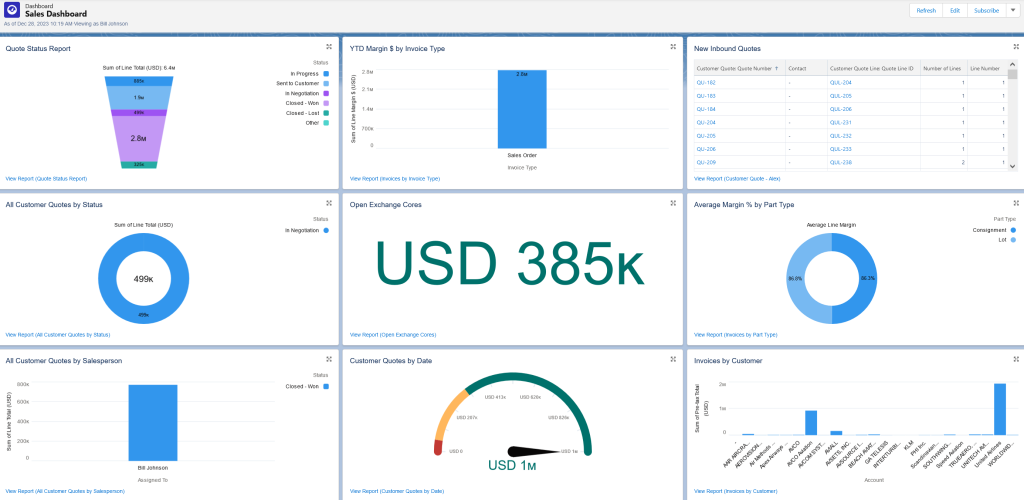
Understanding Charts and Dashboards
Dashboards work hand in hand with reports to allow for at-a-glance data visualization. Whereas reports tend to include a lot of detailed information, dashboards use visual elements, such as charts and graphs, to summarize complex data. This allows you to quickly glean key insights and see trends and patterns. Each dashboard element is based on a report, which is linked to that element, this enables you to drill down into more detailed information with a single click. Similar to the reporting tool, dashboards are set up using a drag-and-drop interface and can be customized by any user.
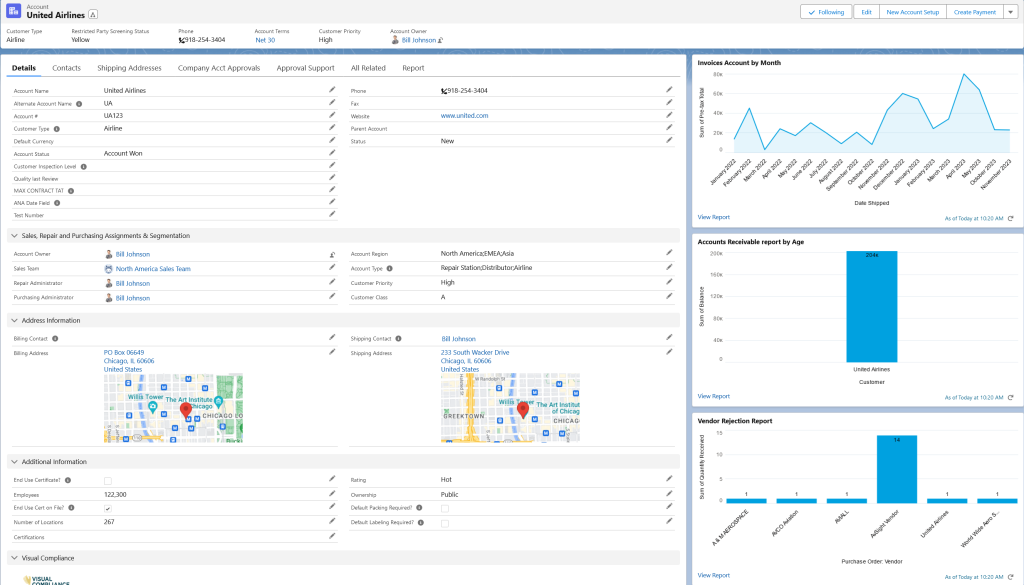
The individual charts and other elements can also be incorporated into layouts throughout AvSight. For instance, finance might incorporate a billing chart into their account page layout to easily see the average age of open invoices for a particular account, allowing them to make quick decisions on temporary credit limit increases.
Functionality and Accessibility
Some of the functionality and productive features of the charts and dashboard tools are;
Real-Time Data: In contrast to many systems, AvSight dashboards and reports provide real-time data that is constantly updated. Enabling your team to make informed and strategic decisions, rather than trying to work off of stale data.
Drag-and-Drop Interface: Reports and dashboards in AvSight are created using a simple drag-and-drop interface. This user-friendly design is fast and intuitive and allows department heads and other employees to quickly access the information they need to work smarter – no coding and no waiting for IT.
Charts and Graphs: Dashboards support a wide range of chart types, including bar charts, pie charts, line charts, and scatter plots. These visualizations make it easy to interpret data trends and patterns.
Data Accessibility: AvSight’s smart design makes it easy to access related data from any record in the system. This applies to dashboards and reports as well – users can click on any data point in a chart or table to access more detailed information.
Sharing and Collaboration: Dashboards can be shared with specific users or groups, allowing for collaboration and ensuring that stakeholders have access to critical data. Report and dashboard updates can even be scheduled to be sent at regular intervals, ensuring that important metrics are always top of mind.
Mobile Access: Dashboards are accessible on mobile devices through the Salesforce mobile app, ensuring that users can access important data while on the go
Security and Access Control: Like all Salesforce features, dashboards adhere to Salesforce’s robust security model. Administrators can control who can create, view, and edit dashboards.
Report Types and Customization
Report types, simply put, can be seen as blueprints for your reports in Salesforce. They are pre-built report templates tailored to different business needs These predefined report types can be used as is or modified to simplify the process of creating your own reports.
If you have unique requirements, you can also generate custom reports. Users can make custom report types by using any number of related objects in Salesforce. This allows for greater flexibility and helps to create reports that align with their specific requirements. If you are keen to know more about how Salesforce reports work we recommend you follow this Trailhead to get a better understanding.
With Salesforce AvSight is able to bring your organization enhanced reporting capabilities. It’s no secret that effective sales and operations lead to business success. By having the right data displayed in a very digestible manner you will be able to properly visualize your data and act with confidence. Take a look at our Self-guided demo or schedule a live demo and find out firsthand.
Experience AvSight for Yourself
Request a demo to see how our next generation aviation platform can give your company a competitive edge.
Request A Demo